
Free TikTok Engagement Rate Calculator
Paste a public TikTok @username. You’ll get a recent, follower-based engagement estimate, the numbers behind it, and the sample we used. No login. No sign-up.
How we count TikTok engagement rate
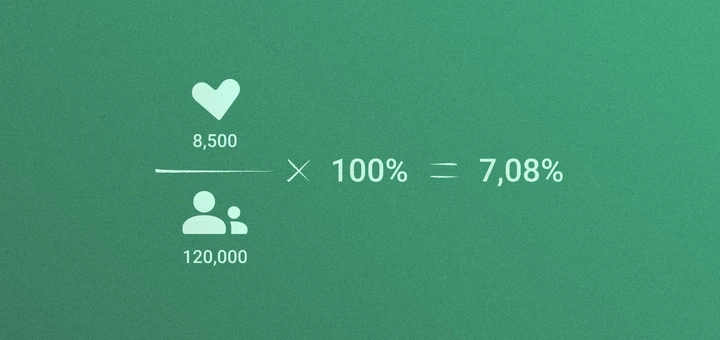
IQFluence averages the visible likes and comments across eligible public videos posted during the last 30 days. That average is divided by the account’s current follower count, then multiplied by 100.
(Average likes + average comments) ÷ followers × 100 = follower-based engagement rate
Here’s a clean example. A creator averages 8,500 likes and 320 comments across recent videos and has 120,000 followers. The calculation is (8,820 ÷ 120,000) × 100. The result is 7.35%.
Why use followers? Public-profile screening has to work with data a visitor can verify. Followers, likes, comments, and video views are visible on eligible public profiles. Reach, saves, link clicks, and audience-level data require first-party access or a deeper creator report.
Need the broader measurement context? Read the IQFluence engagement-rate guide.
TikTok engagement rate benchmarks
| Followers | 1k–5k | 5k–10k | 10k–50k | 50k–100k | 100k–500k | 500k–1m | 1m+ |
|---|---|---|---|---|---|---|---|
| High | > 7.97% | > 3.54% | > 2.61% | > 2.47% | > 2.63% | > 2.46% | > 2.6% |
| Above Average | 4.42 – 7.97% | 1.62 – 3.54% | 1.11 – 2.61% | 1.01 – 2.47% | 1.14 – 2.63% | 1.13 – 1.46% | 1.27 – 2.6% |
| Average | 3.38 – 4.42% | 1.25 – 1.62% | 0.84 – 1.11% | 0.75 – 1.01% | 0.87 – 1.14% | 0.88 – 1.13% | 1.02 – 1.27% |
| Below Average | 1.72 – 3.38% | 0.62 – 1.25% | 0.39 – 0.84% | 0.32 – 0.75% | 0.41 – 0.87% | 0.46 – 0.88% | 0.57 – 1.02% |
| Low | < 1.72% | < 0.62% | < 0.39% | < 0.32% | < 0.41% | < 0.46% | < 0.57% |
Find influencers that 100% match your requirements with IQFluence
How to check engagement rate on TikTok in IQFluence
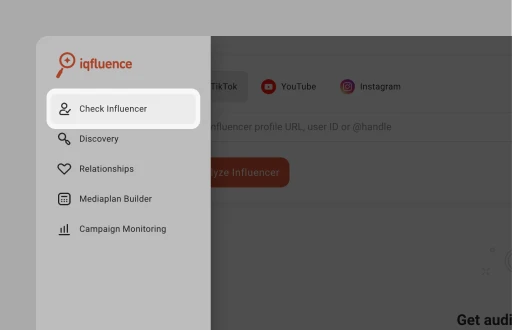 1Head to the left-side menu and find the section labeled Check Influencer.
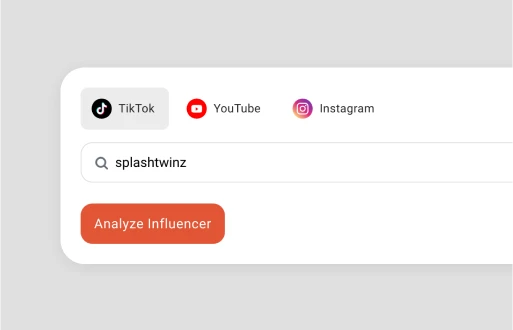 2Click TikTok, type in the @username, e.g. @splashtwinz and hit Analyze Influencer.
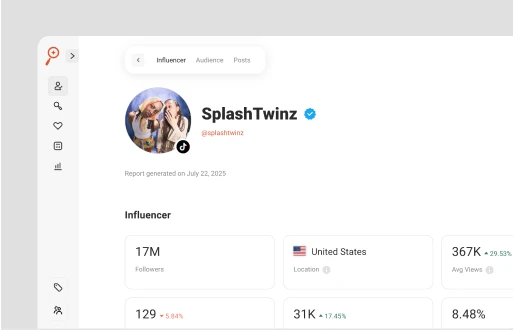 3Boom — a full report shows up, right there, including the engagement rate.
FAQs on TikTok engagement rate calculator
It’s not just likes. It’s not just comments. It’s the whole package — likes, comments, shares, saves, and honestly, just how much people are interacting with a creator’s content. Think of it like this: if TikTok is a party, engagements are how many people are actually talking to the influencer, dancing with them, sharing their jokes with friends. It’s the difference between someone who just shows up and someone who lights up the room.
For this public-profile estimate, average the likes and comments across eligible public videos from the last 30 days. Divide that figure by current followers, then multiply by 100. The formula is (average likes + average comments) ÷ followers × 100.
If you ever wonder how to find TikTok engagement rate, just use this free engagement rate calculator TikTok. Enter a creator’s username and bam — you get it. No spreadsheets, no head‑scratch — our TikTok engagement checker provides fast insight so you can spot genuine buzz, pick creators that truly connect, and supercharge your brand’s ROI.
The way TikTok algorithm works, content can go viral even if you have zero followers. So, the name of the game isn’t how many people follow a creator — it’s how many people are actually interacting with their content. And a 10% engagement rate means their audience isn’t just watching — they’re liking, commenting, saving, sharing. They’re showing up.
To put it in perspective: on most platforms, anything above 2–3% is considered solid. So when you see 10% or more on TikTok? That’s a creator who’s really connecting.
Engagement ? It’s everything. Because follower count? Meh. It’s a vanity metric. What you really want to know is — are people paying attention? Are they liking, commenting, sharing, rewatching? Are they obsessed?
Now here’s the scale:
-
2%–5% = Decent. Respectable. Like, they’ve got a pulse.
-
6%–9% = Solid. This creator is connecting, not just performing.
-
10% and up = That’s your gold mine. That means people aren’t just watching. They’re tuning in like it’s their favorite Netflix show.
Let’s talk about timing. There are better days to post on TikTok. Weird, right? You’d think the algorithm was just chaos and dance challenges. But nope. Timing matters. A lot.
Now here’s what we’ve seen (and what tools worth their salt should be tracking): it’s Tuesday, Thursday, and Saturday.
Those tend to be the golden hours of the TikTok universe — when people aren’t just scrolling, but actually engaging.
TikTok isn’t just another platform — it’s an attention game. You’ve got 3 seconds to hook someone, and if you’re a B2B brand looking for real influencer impact, your strategy needs to go beyond follower count. The content that actually drives engagement? Natural and human. Think storytime videos, behind-the-scenes moments, how-tos with personality, ultra-relatable posts, and trend-jacking with a twist. It’s not about perfect — it's about real. That’s what makes people stop, watch, and engage.
Short answer: Yes — and no. Here's why:
On average, TikTok engagement stats show peaky periods that tend to get more eyeballs. Buffer’s dataset of over a million posts reveals these top slots:
-
Sunday at 8 p.m.,
-
Tuesday at 4 p.m.,
-
Wednesday at 5 p.m.
QuickFrame, pulling from Influencer Marketing Hub, says mornings and afternoons are hot too — think Monday at 10 a.m. and 4 p.m., Tuesday early morning, Wednesday 7–9 a.m., etc.
But TikTok itself? Their guidance is simpler: post great content when your audience is awake and scrolling — it matters more when you hit your specific zone .
Data shows that videos between 15 and 30 seconds often get the best engagement. That’s because people are more likely to watch it all the way through — TikTok’s algorithm loves that. And reality? The average TikTok is just 21–34 seconds long.
Here's how to get it:
-
Post short (15–30s) with a strong hook in the first 3 seconds
-
Ride trends smartly — use popular sounds, niche hashtags
-
Engage actively — ask questions, reply to comments, go live
-
Collaborate & duet with relevant creators
-
Use analytics — optimize posting times, formats, and topics
-
Pick a timeframe (e.g., last 30 TikTok posts).
-
Add up engagements: likes + comments + shares (and saves/clicks if available)
-
Divide by views (for video virality) or followers (for audience loyalty)
-
Multiply by 100 to get a percentage.
-
Compare your rate against benchmarks (e.g., ~5%+ by views, ~2–4% by followers)
Leverage IQFluence TikTok engagement rate calculator free to save your time.
Paste your public TikTok @username or profile URL into the calculator. You can also calculate it manually with the follower-based formula shown above. Owned-account analytics may return a different rate because they can use views, reach, shares, saves, and other private metrics.
Yes. You can check an eligible public TikTok profile without logging in or creating an account.
The profile must be public and have enough eligible recent videos. Private, restricted, deleted, or inactive profiles may not return a result.
The formula, denominator, sample window, and aggregation method may differ. IQFluence uses a recent follower-based public estimate. TikTok Studio can use first-party metrics, while other calculators may divide by views or use a different number of posts.
Not on its own. Check the audience’s location and quality, comment relevance, view consistency, branded-post performance, and campaign goal before hiring the creator.
For more targeted results search for top TikTok influencers based on location or niche
IQFluence can find the best match for your influencer collab
Discover more free marketing tools from IQFluence
- Free YouTube Engagement Rate CalculatorTry our YouTube engagement rate calculator to find out the engagement of any account.
- Free Instagram Engagement Rate CalculatorCheck the IG engagement of any account with a single click.
- Free Fake Follower CheckerSecure your budget by vetting any creators across TikTok, Instagram, and YouTube with a single click.